About Us
Radio IP Software delivers innovative mobile virtual private network (MVPN) solutions that provide mobile workforces with secure, real-time access to a wide range of applications and networks.

Your mobile VPN is strategically positioned in your network infrastructure. It manages critical data. It is aware of the type of network the data is surfing on. It knows which application generates the data. It distinguishes which mobile unit is using which interface.
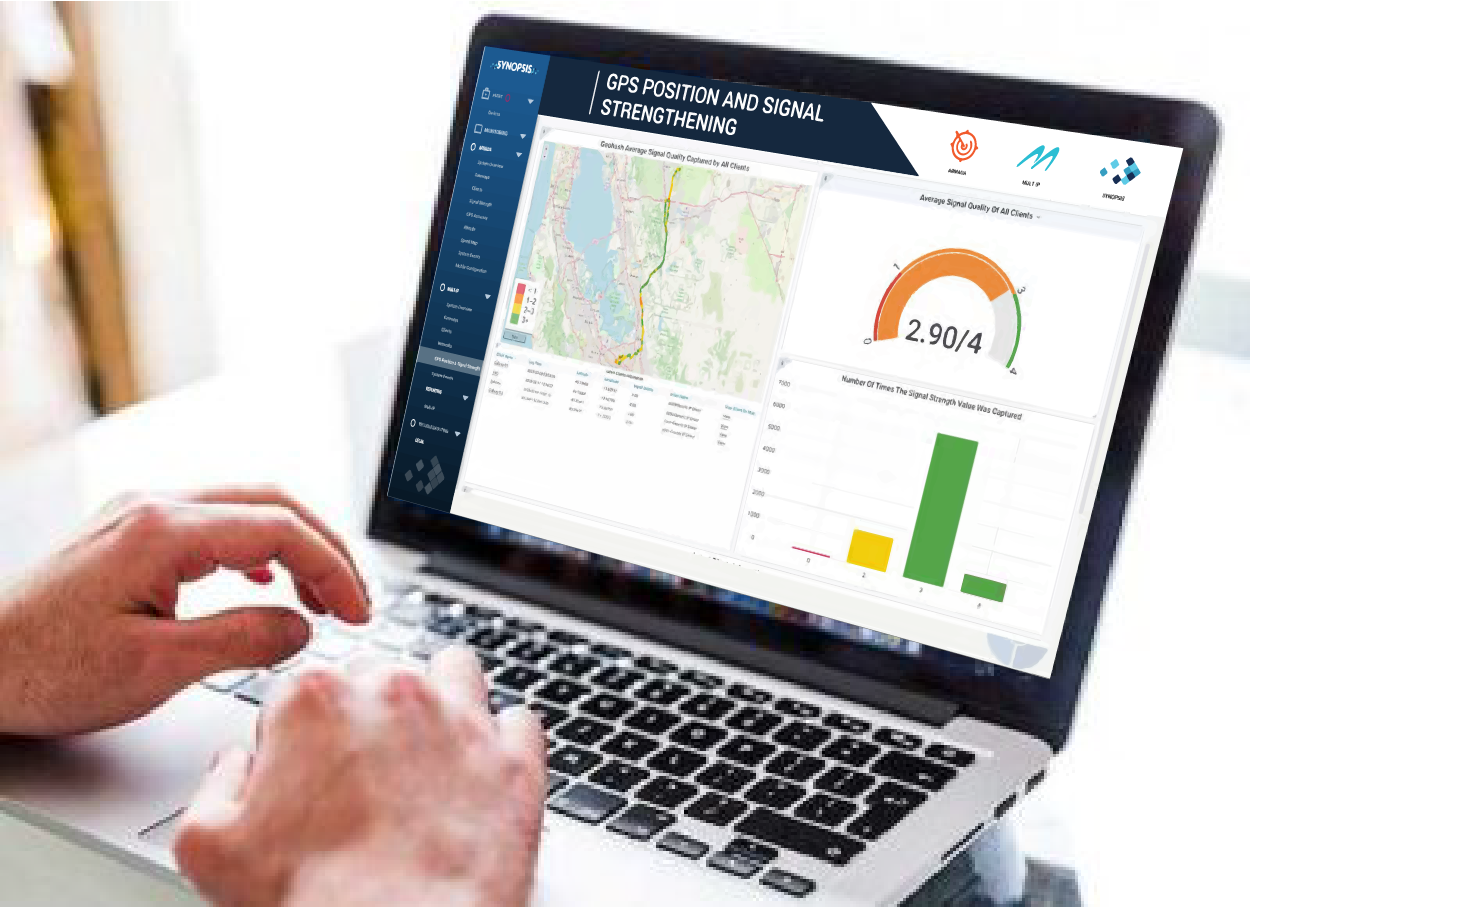
By seamlessly connecting itself to Armada and Mult IP’s reporting engine, Synopsis provides a sleek and easy access to network and application performance, which allows for Real Time Monitoring, Alerting, Signal Strength and Full GPS Tracking and Mapping.
*Professional Services charges may apply based on customization requirements.
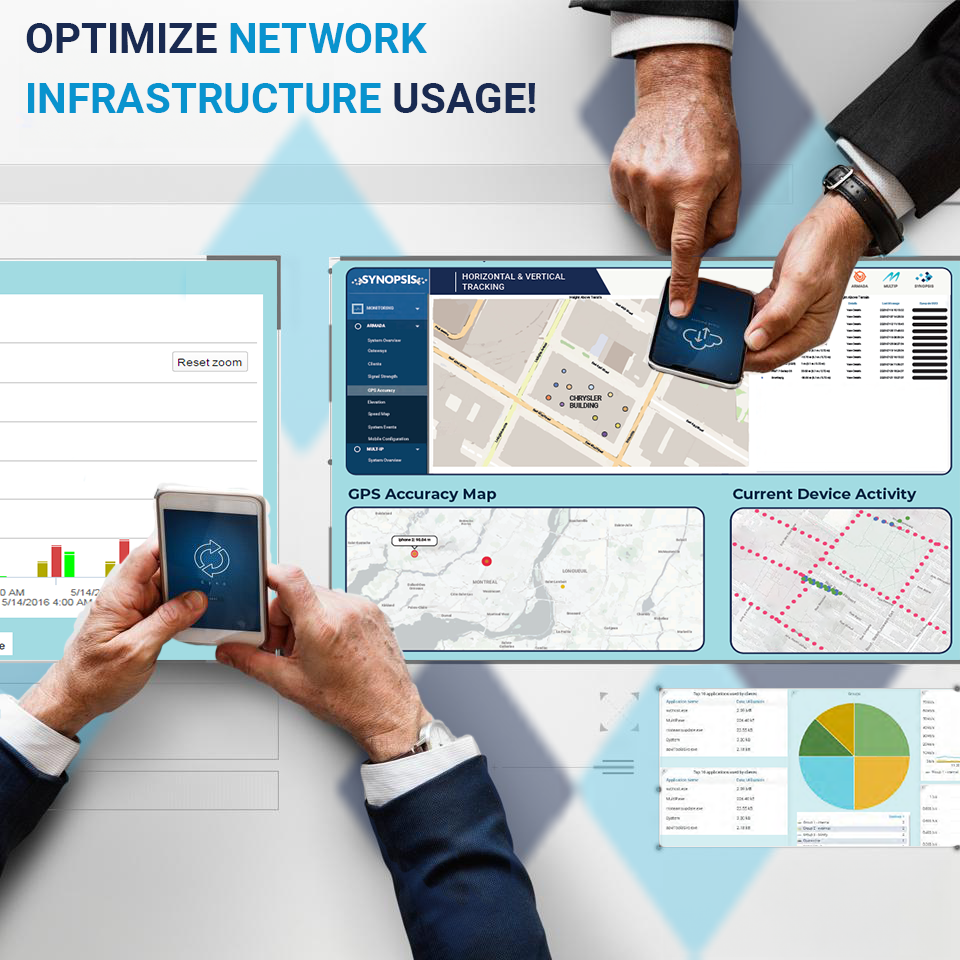
Synopsis allows for real-time monitoring and full 3D mapping geolocalization, including Z-Axis, which provides
a new level of accurate Situational Awareness Benefits:

To Better Manage It

Synopsis helps to identify which network is being used, and how and when it is being used. Use the application or network reports to dig into all the data to uncover utilization trends.
Synopsis will clearly highlight if a costly network is being over-utilized or if cost-effective alternatives could be prioritized.
Browse through gigabytes of system collected data to uncover utilization trends, popular applications, and much more.
Use Synopsis to track and view each units GPS location and signal strength mapping in real time.
Synopsis helps optimizing resource usage. In a few clicks, know which application is most bandwidth-hungry. Understand how and which mobile units consume the bandwidth.
Looking for that application that slows down your operations? Synopsis can show you.
Synopsis will clearly highlight if a costly network is being over-utilized or if cost-effective alternatives could be deployed. Because Mult-IP allows any application to use any network, infrastructure investments will not cause application redesign.
Use Synopsis to browse through system-generated data to get key performance indicators over a specific period of time.

Synopsis seamlessly connects into Armada and Mult IP’s reporting engine to provide sleek and easy access to network and application performance which allows for Real Time Monitoring, Alerting, Signal Strength and GPS Tracking.